Elite Trade Skills

  • Home
  • Live Trading Signals
  • Educational Resources
  • Contact us

Essential Steps for a Successful Trading Plan

April 18, 2023 By administrator

Introduction

A trading plan is the most important factor in determining trading success. A trading plan will help take your emotion out of trading – which will help you make better trades and make you a better trader.

Make sure your trading plan reflects you as a trader.  In developing your trading plan, you should consider factors such as your trading style, your level of experience and your risk profile.  And, of course, your trading plan should be customized to your personality.

One key reason for a trading plan is to ensure you also define your trading strategy completely before you trade – including determining the factors that will be used to measure success.  Do not place any money in the market until you know exactly when you will enter, and then what your strategy is if the market goes up, goes down or goes sideways.

Trading Strategies

A trading plan will:

  • Keep you disciplined
  • Outline exactly what you want to trade
  • Give you confidence in your trading decisions

Your trading plan should encompass every aspect of your trading ventures, including:

  • When you will trade and your trading timeframe
  • Markets you want to trade
  • Risk and money management guidelines
  • Your trading strategies – Entry and exit signals that you will use, as well as your stop loss

If you need help developing your plan, we’ve created a template that helps you develop your own.  This is free – you only need sign up as a subscriber.

Read on to see how to create your own successful trading plan.

Step 1 – Define Goals

As you’re sitting down to develop your trading plan, the first step is to define your goals. Is there a particular reason you’ve decided to start trading? Do you have a financial goal, such as a down payment for a house or a new vehicle? Are you looking to grow your investments for use later, supplement your income or are you wanting to become a full time trader? Take note of your motivations and use them as a basis for your goal.

Your goals should always be realistic. A realistic goal will help keep you focused with a date and clear timeline. Make sure to follow the SMART methodology with your goals; ensure that they are specific, measurable, attainable, reasonable, and timely.

Then, from there, think about your specific trading timeframe and what returns you want to achieve. This is not the final step, however. To keep your goals effective, you need to review and update them every so often as needed.


Step 2 – Set up your Trading Business

               No matter whether you’re a beginner or an expert, looking at your trading as a business will help you stay disciplined. A simple shift in mindset can make a world of difference when it comes to achieving your goals. A business mindset can keep you disciplined as you execute on your trading strategies.

It’s also important to understand your own skill level. If you are a beginner, be aware of that and set your goals accordingly – this goes back to setting realistic, SMART goals. It’s also a good idea to identify your own weaknesses – such as gaps in your own knowledge and experience, and how you plan to fill these gaps. If you are new to trading, it is better to start with less complex trading strategies and less volatile markets.

Next, do an inventory of your trading resources. How much capital do you have? How much are you willing to invest? How much experience do you have?  How much time will you devote to trading?

Step 3 – Define your Trading Style

               Your trading style will be defined by a combination of your risk tolerance and skill set. It is dependent on your personality, strengths, the amount of time you have to trade, and your goals. Take a broad look at each individual component before you decide your trading style.

Ask yourself these questions. Do you want to trade short term or long term? Are you going to take a technical analysis or a fundamental approach? Do you prefer slow or fast moving markets? What is your risk profile?  It is the combination of your skill level, risk profile and trading resources that will help you define your trading style.


Step 5 – Risk and Money Management

Risk is an inherent part of trading and needs to be carefully managed. By setting a maximum loss per trade, and sticking to it with a stop loss, you can specify your risk on every trade and minimize your losses.

An understanding of money management will help you calculate the risk per trade, based on your account size. For example, say you set a risk threshold of 10% of your total capital. This doesn’t sound all that high.  However, a risk of 10% of total capital on each trade would mean that you can only have 10 losing trades in a row before your entire capital is lost.  However, if you set the risk threshold at a 2% risk level, you would have to have 50 losing trades in a row to lose it all.  So although 50 losing trades in a row is very unlikely with a sound trading strategy, you can see that it is a much better risk level to protecting your capital over the long term.

Apply your risk tolerance level to each trade before you place your trade and ensure that you have a stop loss in place to effectively manage that risk. It’s important to understand how to implement your risk level to each trade. Doing so will allow you to determine your position size based on your risk level, entry, and stop loss points.


Step 6 – Trading Strategies

A trading strategy defines your execution. It sets the rules for your desired setups, your entry trigger, and where you place your stop loss. It also helps you decide when to exit and determines which indicators you will use to support your analysis. Your trading strategy should be clearly defined before you trade.

Setting rules for any price action that occurs while you’re trading will help you decide your next move and how to execute your trades. These rules will allow you to trade based on rules you’ve set instead of with emotion. No matter what happens- whether the price rises, falls, or goes flat- you’ll have rules for action.


Step 7 – Record and review

A trading plan is only useful if you track your progress. While it may sound strange at first, it’s a good idea to keep track of the trades you make in a spreadsheet or journal. A trading journal can also help you calculate key statistics, such as hit ratio and edge ratio, which will help you understand how to improve.

List the stock name, the price, why you chose that trade, and whether you earned money on it or not. By reviewing these trading logs, you’ll be able to understand why you made the decision you did. You can review your thought patterns for error as well as see when you were correct in your predictions. These logs can also highlight recurring patterns – whether positive or negative.

Hindsight, as they say, is 20/20. More than that, hindsight is one of the most powerful educators in existence. Having a detailed document to review will let you accelerate your learning by identifying patterns. Identifying where you can improve is key in not only making but keeping your money.


Conclusion

There are several essential steps when it comes to a successful trading plan. You must first define your goals- before you even set up your trading business. After you’ve set up your trading business, you’ll need to keep stock of your own skill and knowledge- which you’ll use to define your trading style. Then, you’ll need to determine your risk tolerance and how you’ll manage your money. Next, you’ll need to set up your trading strategies and trading journal. Finally, to achieve the best results, you’ll need to record and review.

However, completing these essential steps will assist in trading success. By following the above steps, you’ll already be ahead of many other beginning investors. You are now better equipped than ever for trading success.
 

Filed Under: Resources

Trading a Stretched Market

March 27, 2023 By administrator

In this article, we will learn how to identify when the market is stretched into a key level and how to take advantage of this environment by trading the reversal off that key level.  This is a strategy suited to the more experienced trader.

The setup is one of the key concepts we use to trade rebounds. Here we will look at two FX examples in AUDUSD and GBPUSD. Although the concept and the price action behind it works in many other markets such as cryptocurrencies and bitcoin in particular.

Key price level

The first part of the “stretched market” setup is a key price level. The market needs to test the level at least twice.

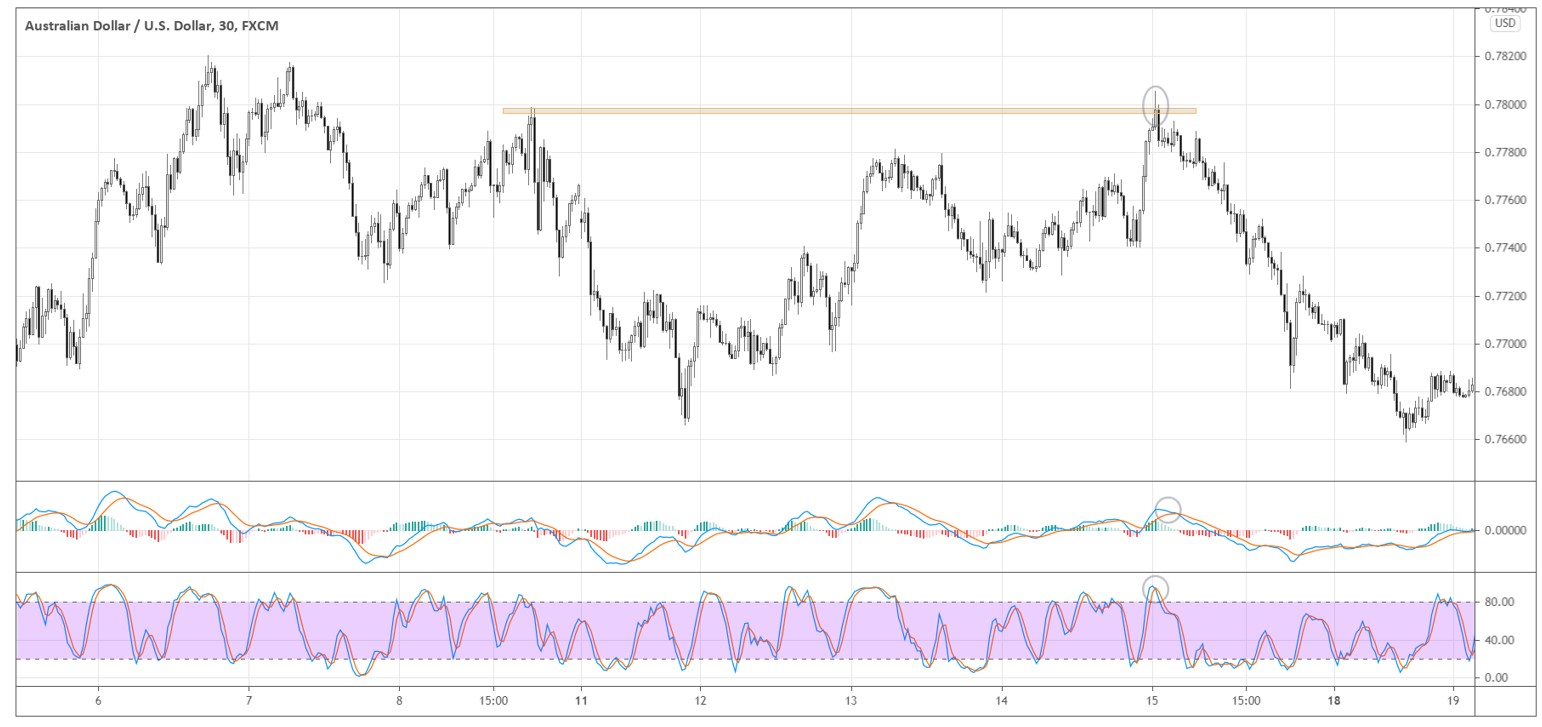
In the thirty-minute AUDUSD chart below, we see the 0.7800 price level that the market tested twice within several days. Pay attention to how the market approached the price level the second time.

Key Price Level

We need to see a specific way of how the market gets closer to the key price level. The move must be “stretched” or steep compared to the recent price action, without many pullbacks on its way.

In the example above, within a couple of hours market approached 0.7800 with long white candles. Buyers were rushing to open their long positions until the congestion of sell orders around 0.7800 absorbed all the demand.

Patient traders who wanted to buy using limit orders probably didn’t get many chances to get filled. If there were no pullbacks, we could assume that there were not many buyers who wanted to close their positions and give chances to patient traders to get in.

What happens when new buyers suddenly cannot push the price higher anymore? People that bought, say around 0.7740, now see a profit on their long positions. Some of them would want to cash in and sell as they are aware that the area around 0.78000 may contain a lot of other competing sellers.

As the price starts curving down under the pressure of sell orders, those that bought just near the resistance would see losses on their positions and would want to get out, adding to the selling pressure.

The bottom line is that those that rushed to buy on the way up would most likely rush to sell on the way down. That’s why steep moves into a price level are often not sustainable, and we can take advantage of it.

Flush it out!

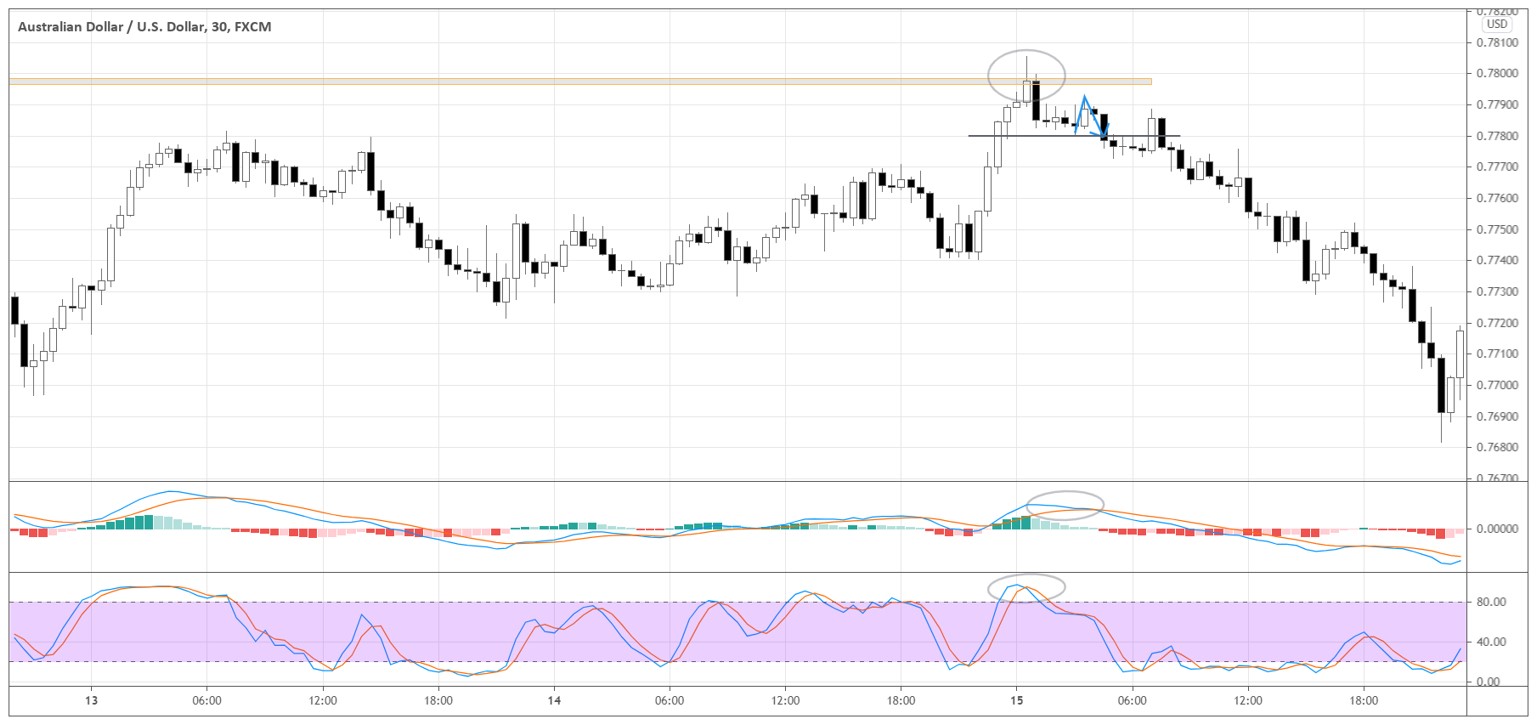
The second part of the setup is the “flush out” price action. The market pierces through the level and sharply rebounds back. In the AUDUSD example above, the market flushed out the 0.7800 level and finished below by forming subsequent candles below the level right after the level is briefly violated.

Such price action forms when there is aggressive selling going on for one reason or another. Seeing this, we can conclude that there is a real interest in selling at this level. The “flush out” increases the odds that the previous up-move will reverse.

Shoulder as an entry trigger

After the market flushed out the key price level and holds below it, we need specific price action to time our entry off the key level. We use the shoulder pattern to get in.

In the AUDUSD example below, the shoulder is marked with the blue arrow. We sell when the down-boundary of the shoulder is broken.

Shoulder is broken

The market formed a little support around 0.7780, the breakout of which coincides with our shoulder-based entry. When the market makes such consolidations around the specific price, it’s easier to identify the shoulder, so the entry is more obvious.

Sometimes it’s difficult to identify the shoulder on the main timeframe, so we may need to go to a lower timeframe to find the shoulder.

To learn more about Shoulder entries see our video on How to Anticipate a Market Change.

Stochastic and MACD confirmations

The final step is to confirm the exhaustion of the momentum. We use Stochastic and MACD to gauge the momentum change. In the chart above, both indicators show the turning point in momentum. Look at the circled areas in the indicators’ windows.

Stochastic was rising to the “overbought” condition without any pullbacks. Although the market can stay in “overbought” while continuing the surge for a long time, the indicator merely shows the intensity of the price movement relative to the recent price action. In a proper context, indicators can support our analysis that the chance of the reversal is high.

MACD has also been decreasing since the market flushed out the key level and consolidated below it, forming the shoulder pattern. By the time the shoulder was formed, we could see a confirmation of fading momentum in MACD.

For more information on using indicators to support your price analysis – see our three part series “My Favourite Indicators”.

Stretched market example in GBPUSD

Let’s look at another example of the stretched market setup. Below is the thirty-minute chart of GBPUSD. The market formed the key price level 1.3700 by testing it several times on the 13th and the 15th.

Stretched Market

On the 15th, the market made a powerful move towards 1.3700 without any meaningful pullbacks. The price level got flushed out as the market formed a long wick above 1.3700 and sharply pushed back below the level, consolidating under it afterwards.

Stochastic soared into the overbought area and started to reverse, confirming the “stretched” state of the market. MACD was also rising, and after the flush out, it started to decline, indicating fading momentum.

We sell when the market forms a shoulder (see the blue arrow right below 1.3700) and breaks below its down boundary around 1.3680. The market formed at least two shoulders while consolidating below the key price level, giving us more opportunities to enter.

Filed Under: Resources

Trading Multi Timeframes

March 14, 2023 By administrator

Multi Timeframes trade example

In this article, we will go through several intra-day trades on Hang Seng, where we can effectively implement our multi-timeframe analysis. Analysing different timeframes helps keep you on the right side of the market and time your entries to catch excellent moves.

Although our examples are on an intra-day time frame, you can apply the same methodology to longer time frames that better suit your personal trading style.

Let’s look at some tips and tricks that you can use practically in your trading.

What timeframes do we use?

To prepare for the trading day and get the bigger picture of the market we use the thirty minute timeframe. During this preparation, we define the key levels and where the buying or selling pressure might be. Our two main timeframes while trading are the five-minute and one-minute charts.

Five-minute charts help us to get on the right side of the market and catch more significant moves.

We use a one-minute timeframe to manage trade execution, where we look at specific candles’ lows or highs and zones for possible entries.

Trade examples

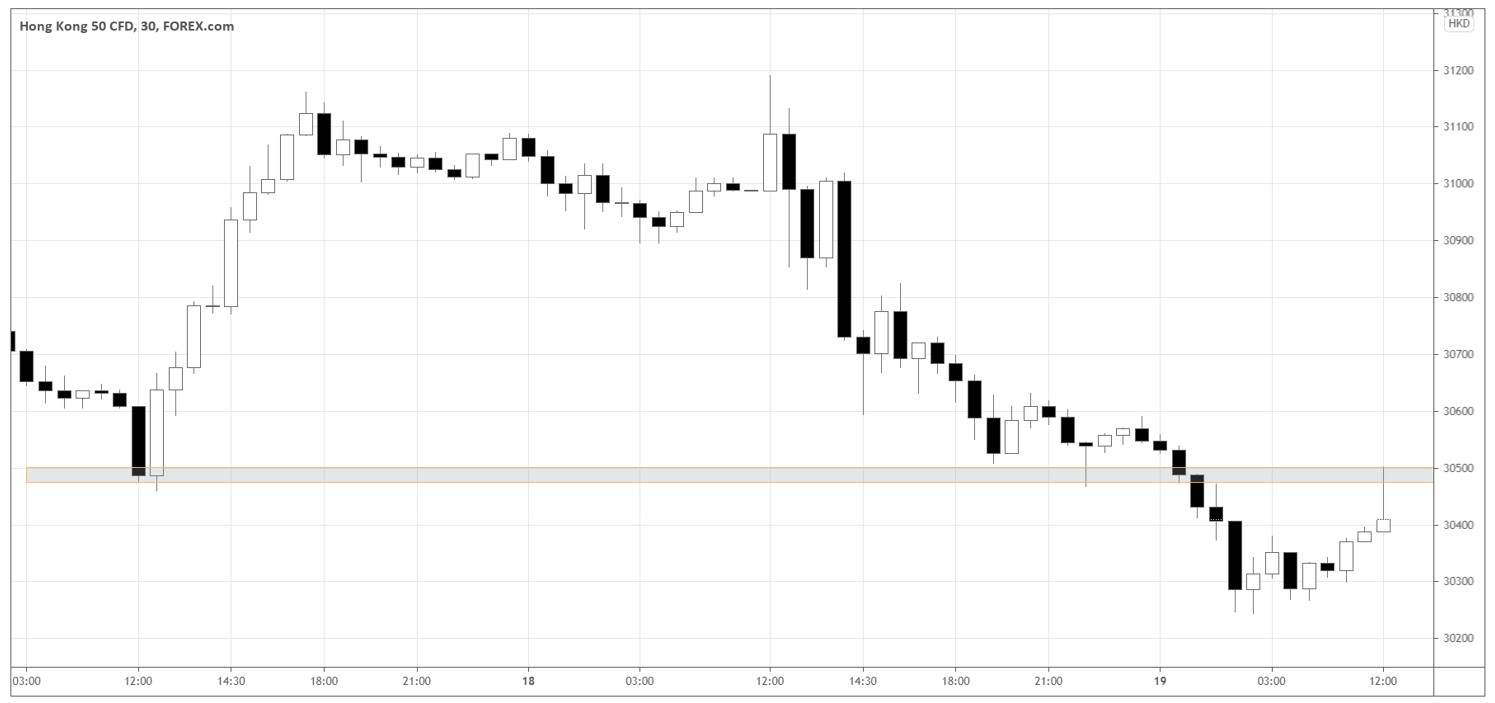
We will start by analysing the thirty minute chart on the Hang Seng Index to understand the big picture of the market. Let’s look at the chart below.

Trading Multi Timescales - FOREX

The key takeaways from the thirty minute timeframe are the following:

  1. Since yesterday, the market has been in a downtrend.
  2. The key price level is around 30500 (see the grey area). The market tested the level several times as a support zone until the breakout occurred, and the support then turned into a potential resistance level.
  3. In the first thirty minutes of the trading session (the main session opens at 12:30), the market formed a “shooting star” candle, which is bearish. The candle appeared near the key price level 30500, showing that the market bounced off the level, thus respecting it.

Given the points above, judging from the higher timeframe’s price action, we want to look for short-sell setups below 30500 and be very careful about shorts above 30500 or even consider longs.

Getting down to the lower timeframes

Let’s look at the three short-sell trades. We use two Exponential Moving Average (EMA) indicators of 20 and 50 periods to define the bias for a given day. MACD (10, 20, 9) and Stochastic (11, 3, 3) help us confirm the momentum.

Setup #1

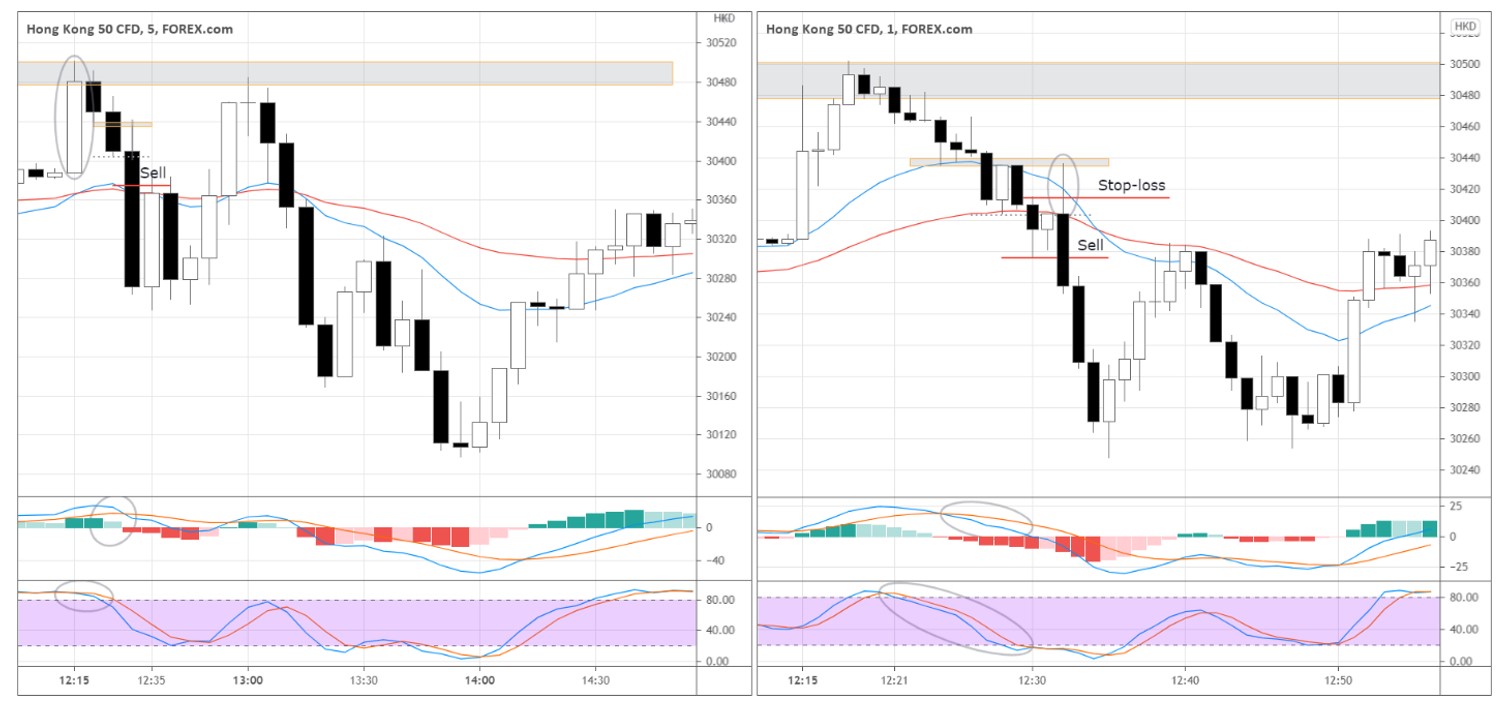
In our example below, we have both the one minute and five minute charts.  EMAs on the five-minute chart showed us that the bias was down most of the day as EMA (20) was below EMA (50). Therefore, on the one-minute chart, we look for setups in the five-minute chart’s trend direction.

Trading Multi Timescales - one minute and five minute charts

The market opened with a white candle (see the circled candle on the 5-minute chart) but got overpowered by the selling pressure, forming two black “inside” candles with the smaller bodies afterwards.

The price action tells us that many buyers at the opening turned out to be wrong. Thus, they are suffering losses as the market going against them. At some point, some of the buyers that got trapped on the wrong side of the market will start selling to limit their losses. So we are now looking for a short entry on the one minute chart.

The ultimate trigger to go short is the upward wick’s appearance (see the circled wick on the 1-minute chart). The wick signals the last unsuccessful attempts of buyers to push the price higher.

The fact that it was happening just several minutes after the index opening adds to the wick’s credibility. We can expect a higher volume of decisive transactions that can move the price.

Notice that the wick tested the black candle’s low on the five-minute timeframe. On the one-minute chart, we can see that the market has been interacting with the same price area (see the grey area around 30440) from the beginning of the trading session, forming the ultra-short-term resistance, which gives us additional evidence of the selling pressure.

The sellers absorbed the impulse upward, and the market quickly retraced down. We sell at the breakout of the last black candle’s low on the one-minute timeframe. The “sell” red horizontal line represents the exact entry price.

The momentum indicators confirm the downward pressure as MACD and Stochastic decline before the entry. Check the circled areas in the indicator windows of the indicators in the chart above.

The stop-loss deserves special attention here. The first that comes to mind is to hide the stop above the wick or even above the newly formed short-term resistance. However, in that case, the stop would be quite wide, hurting our risk-to-reward ratio.

In this trade case, we used a shorter stop-loss of 40 points that we hid above another micro resistance level. The low of the five-minute candle forms the micro resistance. On the one-minute chart, you can see that after the market pushed down through this price (30404), the white candle couldn’t exceed the price, signalling that the market participants are interested in selling at this price.

We take profits when the down-impulse finishes as the first white one-minute candle appear, or we can close the position using the take-profit pending order.

Look out for warnings!

The price first tested 30250, and then we saw a subsequent retracement up-move that then fell back to the new low.  We could consider going short at this point if the market breaks through 30250.  However, instead of rushing into another short, we waited for the price action to confirm an entry.  The more we saw, the less we wanted to be short again even if the market fell below 30250.

Trading Multi Timescales - Warnings - Possible Short

Before the market rebounded up from the newly formed local support at 30250, it gave a warning against further shorts – the price was forming a consolidation zone with the lows consistently above 30250 as seen on the one-minute chart above.

The consolidation was signalling that more buyers were interested in getting in at these prices.

Such behaviour makes the 30250-30275 local support even more significant. Keep that in mind as we move on to our next viable setup.

Why not go long?

Not long after our first setup, the market retested the 30250-support area and retraced back to the 30400 price level.  We have already identified this as a key price zone.

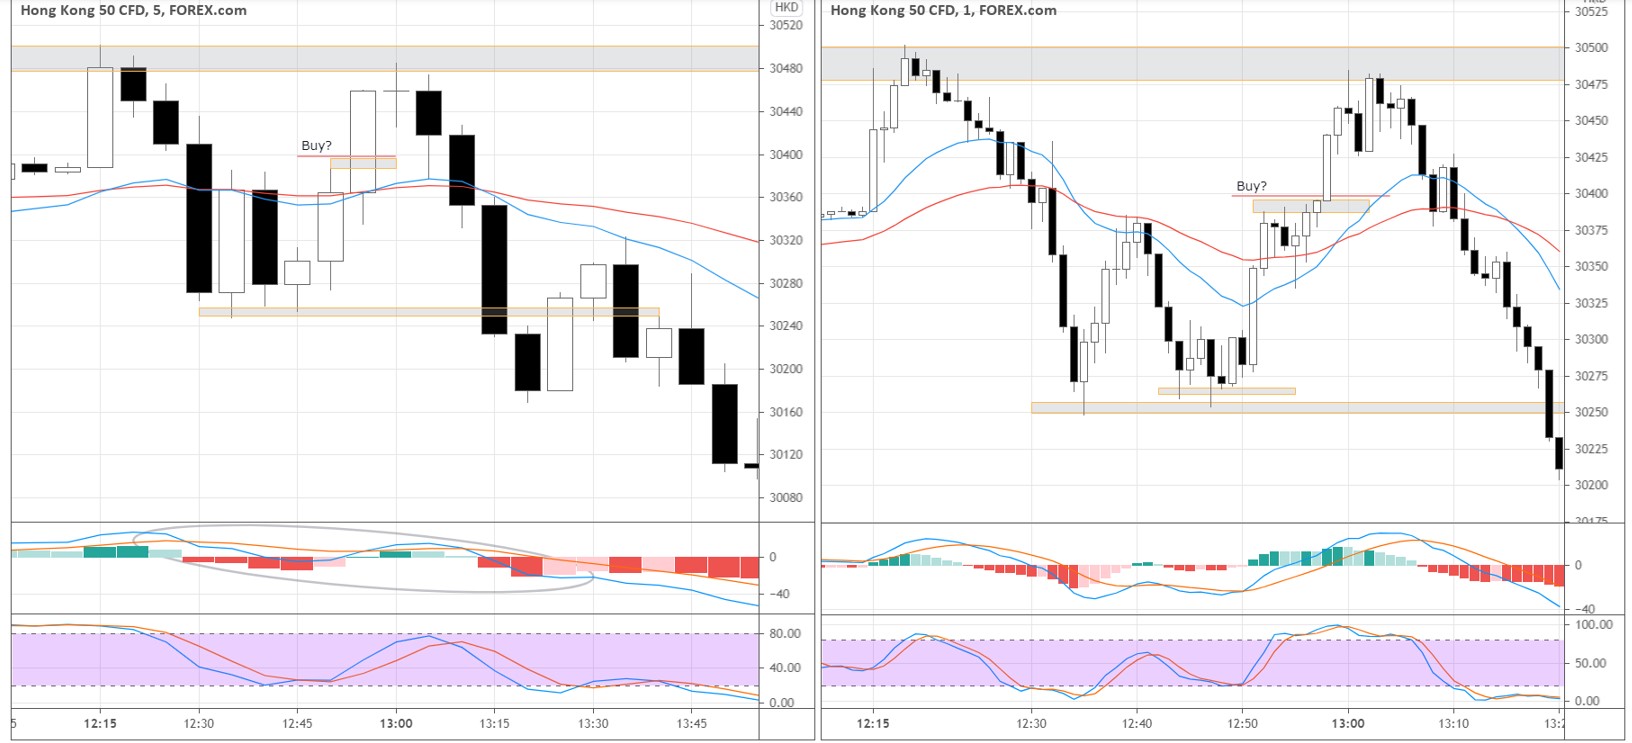
Before a swift impulse through 30400, the market was ranging for five minutes just below this key zone, Such consolidation might also be considered a long entry opportunity. Look how the price action uncovers in the chart below.

Trading Multi Timescales 2

However, if we look at the five-minute timeframe, the general momentum is downward, as we can see from MACD (see the circled area).

Another factor that is playing against the long setup is the big picture of the thirty minutes timeframe. Do you remember the 30475-30500 support-turned-resistance area? If we buy against this resistance, there is not much of a move potential to justify the risk.

It would always be a great idea to double-check how your setups are aligned with the higher timeframe.

Setup #2

As the price rebounded up from 30250 support and approached the 30475-30500 resistance, we want to use the five-minute chart to look for a turning point to fade this up-move.

The market offered the first price action signal by forming a Doji candle near the resistance.

The people that bought around 30250 would be alerted by such price behaviour, and some would decide to take profits by covering their long positions, thus selling.

EMAs can also help us to identify the entry point. When EMA (20) goes above EMA (50) on the one-minute chart and starts to show the signs of weakness, we consider short trades on the five-minute timeframe. As you see, the signs of weakness coincided with the breaking of Doji’s low on the five-minute timeframe (see the illustration below).

Trading Multi Timescales - Signs of Weakness

Further selling pressure broke the Doji’s low and formed a “Shoulder” pattern afterwards (see the blue arrow in the chart above). That’s all we need for the short-sell entry.

We sell when the market breaks the shoulder’s low. Our Stop-loss is above the shoulder’s high.

The objective exit area would be beside already familiar the 30250-30275 support.

Setup #3

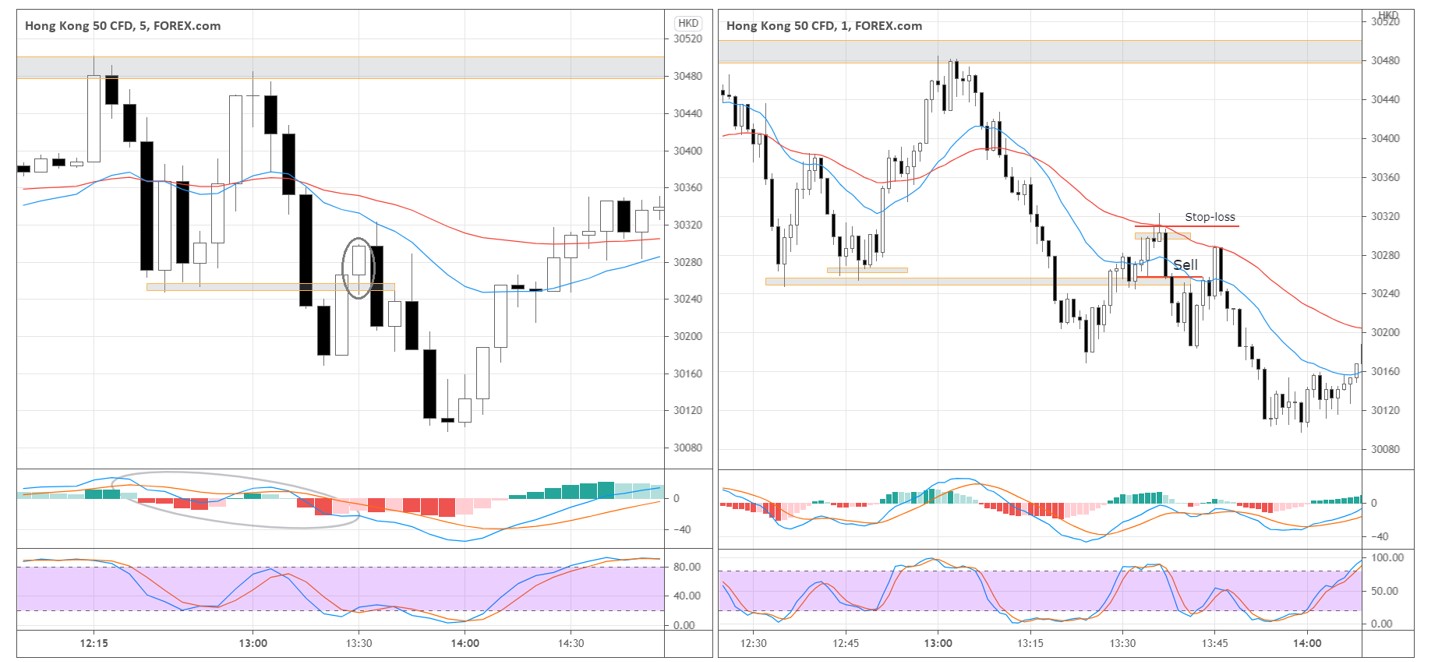
The final setup could test our patience in a way. On the five-minute timeframe, we have a bearish environment: EMAs are heading down, and MACD is declining to show bearish momentum. The focus was on the second white candle that pushed above 30250 (see the circled candle on the five-minute chart).

Once the next five-minute candle exceeded the previous candle’s high and quickly dropped to the 30250, forming a big black candle on the one-minute timeframe, we sell with a stop-loss above the black candle’s high or the swing’s high (see the chart below).

Trading Multi Timescales - Stop Loss

If the market loses steam to move higher away from the support but instead attacks the former support, we get another sign of the weakness that stacks more odds favouring a short-sell trade.

Traders that bought above 30250 support now suffer losses as the market tanks below the support. As buyers cover their positions, it adds more fuel to the proceeding down move.

Depending on your trade management, you might have withstood the subsequent deep pullback from 30180 to 30280 without being shaken out of the position. In the case of our specific execution, the position was covered with the first signs of the upcoming pullback as the market was testing the previous low around 30180, grabbing a small profit.

The approaching end of the session played a role in our more risk-aversive style of exit on this trade.  We took the exit on the first sign of weakness in the down move to reduce our risk at the end of the day. However, if we had held through the pull back and respected the opening stop loss, further gains would have been made.

Conclusion

We looked in detail at the trading session in Hang Seng. Understanding the big picture and following the market momentum on the five-minute timeframe are the keys to staying on the right side of the market and pinpointing the exact entries on the one-minute timeframe. Technical indicators help confirm the momentum direction, and the price action enables us to identify entry points and limit the risks.

A key to selecting successful entries is in your market preparation and identification of key price zones. And using these key price zones on the lower time frames to assist in your price analysis.

Filed Under: Resources

Trading Online: 7 Top Tips

February 15, 2023 By administrator

If you’re new to trading, you might be feeling a bit overwhelmed. There’s a lot to learn about trading, and much terminology to learn and understand.  Sometimes, information can even seem conflicting, leading to an overall sense of confusion. Where do you start to educate yourself about trading online? What are the first steps that you should be taking to trade?

We get it. To help, we’ve developed a list of the top seven tips for beginners. This list will help you begin to learn how to trade online.

Tip 1:  Protect Your Money

Though it may sound obvious, protecting your money while you trade is often overlooked or misunderstood by those new to trading. The best way to protect yourself is to understand that trading involves a level of risk to gain your reward. To trade effectively, you’ll need to effectively manage your risk.  One way to do that is by limiting your exposure to unprofitable situations.

Whether you have $10 or $10,000,000, protecting your money is critical to online trading success.

When learning to trade online, it’s important to be realistic. Trading is not a tool to get rich quickly – but it can be a tool to get rich over time. It is unrealistic as a beginner to believe that you can enter the markets, make a large amount of money, and then exit swiftly in a few days. This is not a realistic goal for new traders. Instead, focus on preserving your capital as you invest and learn. Stick to the basics until you’ve really learned the ropes.

It’s safer to take risks when you have more experience – so save more aggressive trading strategies until you’re both more confident and more experienced.

The goal in the short run is to continue trading. You won’t be able to do that if you run out of funds to trade with. Learn to minimize your losses first through effective risk management, including a stop loss. This is the key to all successful traders. Then you can learn to maximize your gains.

Tip 2: Set Realistic Trading Goals

Setting realistic goals will keep you focused and disciplined. It will also help you decide what you’re looking to achieve and when. Having a goal will also help you measure whether you’ve been successful or not.

The key is being realistic. If you’d like to see an ROI of 20% in your first year, that may well be achievable. However, earning a six-figure income in three months is probably not. When setting goals, use the SMART model: your goal should be specific, measurable, attainable, reasonable, and timely.

Your first goal when learning to trade online should be to protect your money. Surviving is the most important element of success when trading online. Determine how much you have, how much you’re willing to invest, and what your likely returns will be. Then, focus on the goals you’ve set and re-evaluate them when needed.

Tip 3: Keep a Trading Journal

While it may sound strange at first, it’s a good idea to keep track of the trades you make in a spreadsheet or journal.  List the market instrument, the price, why you chose that trade, and whether you earned money on it or not. By reviewing these trading logs, you’ll be able to understand why you made the decision you did, and determine if you did in fact follow your trading strategy. You can review your thought patterns for error as well as see when you were correct in your predictions. These logs can also highlight recurring patterns – whether positive or negative.

Hindsight, as they say, is 20/20. More than that, hindsight is one of the most powerful educators in existence. Having a detailed document to review will let you accelerate your learning by identifying patterns. Analyse what worked and what didn’t work and learn from both your winners and losses.

The following is a list of the key facts you should keep in your trading journal:

  • The market instrument, whether it was a long or short position, and the position size
  • If you added to the position, and why
  • Date and time you executed this trade
  • Entry and exit price
  • Stop loss price
  • What your profit or loss is/was
  • Why you entered this trade and trading strategy, including exit strategy
  • Why you exited the trade
  • Did you follow your strategy

This data will allow you to calculate and track your key trading data:

  • Win loss ratio (how often you pick a winning trade)
  • Edge Ratio (ratio of total win value to total loss value)


Tip 4: Have a Trading Plan

A trading plan is the most important part of your trading – so much so that we’ve created an article that helps you develop your own. Your trading plan should be tailored specifically to you; your trading style, your trading goals and your current level of trading knowledge and experience.  A trading plan will:

  • Keep you disciplined as you learn to trade online
  • Outline exactly what you want to trade
  • Give you confidence in your trading decisions

Your trading plan will ensure you know what you will do for any trading scenario, so your actions will be based on a well thought out plan, and not a reaction made in the heat of the market action.

Your trading plan should encompass every aspect of your trading ventures, including:

  • Entry strategies
  • Exit strategies
  • Risk and money management
  • Resources

Tip 5: Remain Disciplined

Trading success may begin with a plan, but it certainly doesn’t end with one. Trading is something you must learn from every day in order to be successful over the long term.

By following the tips above, you’re already a step ahead of everyone else that is looking to learn how to trade online.  The most important thing from here on out is to stick to your plan and apply what you’ve learned. If you don’t, your goals will likely never come to fruition.

Trust in yourself and the plan you’ve put together.

Tip 6: Be Patient

Unfortunately, being successful in trading can sometimes take time. You might make great returns in a single trade over a month, and then immediately lose it in a week.

This is why patience is so important when it comes to trading online successfully. It is important to accept in trading that sometimes you will win, and sometimes you will lose.  Do not expect to always pick a winning trade every time you enter the market.  Even the most experienced traders never achieve this. The key is to win more often than you lose and ensure that your winning trades are bigger in value than your losing trades.   If you get this right, then you will make profits from trading.

Tip 7: Keep a Positive Mindset

Keeping your thoughts positive will help you stay passionate about trading, and that passion will help you keep improving. Keeping positive, though, is easier said than done when markets are volatile or you are losing money.

Try not to let small losses impact your confidence. If you stick to your plan, everything should work out fine in the end. Small losses are a part of process and simply the cost of doing business when it comes to trading.

Trading Online: The Bottom Line

Initially, trading online can be an overwhelming and even daunting experience when you are new to the markets. However, with the right approach and a willingness to learn, the rewards from trading can be significant.

By following the tips above you’ll be better prepared than ever to start your trading career.


Filed Under: Resources

3 Step Plan for Trading Success

February 15, 2023 By administrator

Ask yourself why do you want to trade?

Many people would say that’s obvious – I want to make extra money, or I want to work for myself. If that is the case for you, it would follow that to make money you need to have a businesslike approach to your trading. Making money from trading is not difficult, but it is also not automatic. It is like any other career path. You must put in the time and energy to learn your profession, like you would with any other business or career.
If your trading is just a hobby, or you just like to have a bet on the markets like you would on a sports game, then that’s OK too.

But beware! If you start out thinking that I am happy to risk $1000 to try trading, then that is most likely exactly what’s going to happen. You will lose your $1000!

Trading with an arbitrary and unsystematic approach that is more to do with luck than good judgement is little more than gambling. So many times we have seen traders who start out with some (often big!) wins, and then lose it all. Without applying a systematic and disciplined approach to your trading, utilising proven trading strategies, your chances of success are very small.

The outcome in your business of trading does not rely on luck. It is the result of your hard work; the result of setting goals, creating a plan and implementing that plan.

Your trading plan should cover these three critical steps:
1. Market Analysis
2. Defining your Trading Strategy
3. Your Trade Management Plan

Define what you will trade and when, do you homework to find those opportunities and then manage your trade. Simple!

Step 1: Techniques for market analysis

Market Prep

Market Prep is an essential process you need to undertake before beginning any trading activity. You are trading blind if you start entering trades without having completed your Market Prep.

Your Market Prep should include an analysis of the market to date. This analysis may be on a number of different timeframes depending upon your style of trading. The analysis will include different steps depending upon what instruments you are trading.

For example, if you are an intra-day futures trader, your analysis will focus on the specific futures market or markets that you trade. On the other hand, if you invest in stocks end-of day as a position or swing trader, your Market Prep will include a scan for stocks that meet your entry criteria.

For a stock market investor , your market prep should include :

1. A review of general market conditions. You should consider if there are any major news stories or events that may impact the market. In particular you should determine if there are any key economic data or reports due, and any key trading dates such as options expiry. Then look for any company reporting dates of either positions you hold, plan to invest in, or for large companies that are likely to impact the sector you are investing in.

2. An analysis of the daily chart of the overall market to date to identify key trading zones including major and minor support and resistance areas, the current state of the market (ie trend or consolidation) and an assessment of the next likely direction for price movement. Include in your analysis key price zones in which you expect to see trading activity based on your analysis.

3. A scan of stocks to identify potential investment opportunities based upon your investment strategy or strategies.
The next step in your Market Prep is to consider any open positions you are holding. Review the initial investment strategy and determine if the original premise for holding these positions is still valid. Determine your trading strategy for these positions, in particular your exit strategy, profit target and stop loss strategy.

Trading Journal

Consider keeping a trading journal. Determine your plan for recording and reviewing trades for each trading session. Also determine your plan for your longer-term review of your trading, including review of weekly (or monthly) goals and setting of new goals.

Determining Market Structure

The market moves between four basic structures:

➢ An uptrend where the price is generally increasing over a longer-term period
➢ The uptrend is followed by a consolidation where price moves sideways, oscillating between two price points.
➢ A downtrend where the price is generally decreasing over a longer-term period
➢ A downtrend is followed by a basing period where price moves sideways, oscillating between two price points.


Market Ctcles - Uptrend


The diagram above shows different market cycles when an uptrend is followed by the market topping, a short consolidation and a new down trend develops. As a trend becomes exhausted a basing period takes place in preparation for a new trend to develop with the process repeating.

Notice that the retracements within the trend are marked with red and green boxes. These boxes define the premium areas where we look to trade the markets.

Understanding market structure is a key to developing timing techniques. Price action moves in different cycles from expansion in price levels (trends) to a contraction in price levels (consolidation or base periods).

Price expansion occurs as market participants move in from the sidelines bidding higher prices or accepting lower prices. This forces traders already involved to accept losses or take profits to close their open positions.

In up trends and down trends, countertrend moves (retracements) will flush out market participants as traders exit out of fear of losses or decreasing profits. Once the majority are on the sidelines the financial instrument can attract new buying/selling demand which pushes prices to new highs or lows.

Step 2: Defining your Trading Strategy

Your trading strategy is determining the premium retracement zones in a trend that meet your defined criteria. Your trade entry is the point where you move from analysis to trade management. This is when you take on the emotional and psychological aspects of trading.

All your fears and hopes come into play when you have your money out in the market!

Fine-tuning your entry skills will not only help increase your profits, but also help you build your confidence. Feeling confident that you have selected a great entry will create a positive mind-set for the remainder of your trade. Feeling unsure about your entry is not conducive to a successful trading outcome.

We will consider a number of factors that increase the probability for a successful trade, however we will not be providing a prescriptive list of criteria. The market is a mass of individuals all making independent decisions based on their own situations and perceptions. As a result, the market does not always fit into nice neat patterns and rules.
The key is for you to learn how to read the market, understand the current market environment, assess your risk-reward ratio, and use these factors as the basis for your decision.

Keep in mind that to build the skills for executing effective entries over time comes through practise and experience. You will also find that you might utilise a combination of techniques depending upon the situation.

Guideline for structural trade setups with trend
The context of the market is key.

➢ Wait until the transitional or basing stage plays out.
➢ Look for price to break the range.
➢ For “long trade setups”(upside movement) most price bars must be above the Moving Average
➢ Look for price to retrace the breakout leg.
➢ Anticipate that the low of the retracement will be tested at least once before the major trend resumes.


Example 1 Low and High risk areas to trade in relation to the Moving Average

Low and High risk areas to trade in relation to the Moving Average

This chart had a transition/base stage playing out from August 2011 to December 2013.

Price prior to this had been falling (Downtrend). We do not initiate trades in this environment as it is obviously very difficult to make money trading when the price is steadily falling with only brief upside moves.

The transition period is where price moves in a band. Not making large moves higher and also not making new low prices. As a transition stage evolves it helps us to acknowledge that selling pressure is dissipating and buyers and sellers are closer to an equilibrium.

For conditions to be favourable for a trade, we want to see signs that buyers are prepared to step up to the plate and bid higher prices than in the past. (Accumulation phase)

Once this occurs price will mostly hold above the moving average which in this example is set at 33.

We are looking for potential buy areas in low risk areas which are marked.

We look to reduce position size or avoiding buying in the high risk areas as marked which are away from the moving average line.

Think of the moving average as a rubber band. The further price moves from the moving average line the higher the risk that price will snap back to the moving average.

Many traders have heard “retracements from trends are a great way to trade”. I agree with this view. However, I also strongly believe that patience and timing is crucial to creating a significant edge as a trader.

Taking your analysis a step further, and by anticipating a second and sometimes a third probe before price holds, you can ride the predominant trend with higher success rates without being stopped out prematurely. These appear on the charts as a “W” type formation.

W type formation

Exit Strategies

Our exit strategies rely on our price analysis to tell us when market sentiment is changing and there is a potential for a price reversal. An ongoing assessment of your risk reward ratio is also a key component of determining when you should be exiting or reducing your position.

The further price moves from the moving average line the higher the risk that price will snap back to the moving average.

Signs of weakness are signals that you can read in the charts that provide clues that the market is changing. All of these are based on an understanding of chart analysis and reading the actions of buyers and sellers.
Specific signals that you should look for include:

➢ Extended directional price moves away from the moving average increase the risk of a snap back to the moving average.

➢ “M” Type formations that form when holding a long position show a retest of a high that has failed to break higher.

➢ Tails and shadows. This is a powerful signal for a potential change in market sentiment. A large tail on the top of a candlestick shows that buying pressure which moved the price to its high has been overcome by sellers who have pushed the price right back down. A series of candlestick tails after a directional price move combined with an extended move from the moving average often marks a high risk area.

➢ Period Close. Pay attention to where the close of the period is. This is a strong signal for the most likely movement for the next period. Candlesticks that close on their highs or lows are particularly relevant.

➢ Reducing range is also a signal of a move running out of strength and a potential reversal.

➢ Price approaching a previous support or resistance area also provides an opportunity to see if this support or resistance will hold and whether the price will reverse after hitting this area.

If you are risk adverse and a conservative investor, you need to be careful that you do not read these signs from insignificant market moves and exit your positions too prematurely.

All trades will suffer retracements and price movements within a trend, and you need to give the stock enough ‘wiggle room’ to ride out these movements. Determining how much room to allow will be based on the natural volatility of the stock and your time frame. A longer time frame requires more flexibility.

It may be more appropriate for a longer term investor to employ a multi-tier exit strategy, where part of the position is exited on a sign of weakness, and the remainder exited at a technical stop.

Step 3: Trade management plan for trading consistency

Jumpstart Trading Plan
Your trading plan will define all your trading rules. This is where you determine which trades you will enter and how you will manage them. It should contain all the rules you need to follow for any price action that eventuates. It is the plan for the way you want to execute your trades.

Having set rules for any price action that occurs on your trade will assist you to trade with sound judgement and not with emotion.

➢ You have a rule if price goes up
➢ You have a rule if price goes down
➢ You have a rule if price goes sideways

Trading a Numbers Game

Rather than focussing on financial outcomes, we suggest you focus on improving your trading statistics. This is like analysing the profit margins in your business so you know where you need to improve.

The key statistics we look at are:
➢ Win/loss ratio
➢ Edge ratio.

Other statistics that can be useful in analysing your results include your largest loss, largest winner, and number of consecutive winning trades and number of consecutive losing trades.

Win/Loss Ratio or Hit Rate

Your Win/Loss Ratio is a measure of the number of times you have a winning trade as compared to your number of losing trades. We also call this ratio your Hit Rate. It represents the number of times you “hit” a winning trade.
To calculate your Win/Loss Ratio use the following formula:

Number of winning trades / Total number of trades x 100 = Win/Loss Ratio

The ratio is expressed as a percentage. For example, if you executed 50 trades and found that you had made a profit on 30 of them, then you win/loss ratio would be 30/50×100 = 60%. This means for every ten trades you enter using this particular trading strategy, on average six will be profitable and 4 will be losses.

Edge Ratio

Your Edge Ratio is a measure of the size of your winning trades compared to the size of your losing trades. A high Edge Ratio will indicate that you keep your losses very small and let your winners run to large profits. A low Edge Ratio will indicate that the average value of your losing trades is high when compared to the average value of your winning trades.

To calculate your Edge Ratio, use the following formula:

Total value of Losing Trades / Number of Losing Trades = Average value of Losing Trades

Total value of Winning Trades / Number of Winning Trades = Average value of Winning Trades

Average value of Winning Trades/Average value of Losing Trades = Edge Ratio

For example, assume of your 50 trades, you had 30 losing trades with a total loss of $5,000 and your 20 winning trades had a total profit of $10,000. Your average losing trade value is

$5,000/30 = $167. Your average winning trade value is $10,000/20 = $500. This gives you an Edge Ratio of 500:167. To convert this to a simple ratio, divide the average winning value by the average losing value and ratio it to 1. Thus, 500/167=3 so the Edge Ratio is 3:1.

This means that on average the value of your winning trades is three times higher than the value of your losing trades.

The value of your Win/Loss Ratio and Edge Ratio in isolation is of little value. It is the combination of the two which is important. A trader can have a profitable business with a Win/Loss Ratio as little as 30%, as long as that trader is achieving a high enough Edge Ratio (in the vicinity of 4:1). Similarly, even if a trader achieves a very high Win/Loss Ratio, that trader can still lose money overall if they have very large losing trades and only small winning trades (ie a low Edge Ratio).

In the example above, we have a trader with a Hit Rate of 40% and an Edge Ratio of 3:1. Using the numbers in the example above, this resulted in a profit of $5,000.

So even though only 40% of the trades are winning trades, the overall trading is still profitable as the Edge Ratio is high. On the face of these statistics, you could say that this trader is good at keeping losses small and may wish to concentrate on their entry criteria to improve their Hit Rate.

If you have already started trading, take a sample of the last 10-50 trades, record the profit and loss on each trade and calculate all of the following statistics.

➢ Total Number of Trades:
➢ Number of Winning Trades:
➢ Number of Losing Trades:
➢ Total Value of Winning Trades:
➢ Total Value of Losing Trades:
➢ Hit Ratio:
➢ Edge Ratio:

What do these statistics tell you about your trading and what areas might you need to concentrate on?

This is for general informational purposes and does not take into account your objectives, financial situation or needs. For specific financial advice we recommend that you seek independent professional advice from a licenced financial adviser.

Filed Under: Resources

  • 1
  • 2
  • Next Page »

Join our FREE Telegram Channel to receive signal alerts from some of the industries most talented traders.

Join us today and start your journey to becoming a confident and skilled CFD trader

LEARN HOW JOIN NOW

arrow

Contact us

Please contact us with any question you may have, we'll be in touch as soon as possible..

Disclaimer

The training services, products and information provided by Elite Trade Skills is for educational purposes only and designed to contribute to your overall understanding of various types of trading strategies and how to apply this information to the financial markets. It does not provide any investment advice and does not involve any recommendations in relation to personal financial circumstances or investment needs.

The information provided may not be suitable to your individual circumstances or needs. You should always obtain independent investment advice from a licensed investment professional prior to making any investment decisions.

Disclaimer

All trading of stocks, options, futures, or currencies may not be suitable for everyone. Equities, Futures, Options, and Currency trading and investing have large potential for rewards, but also large potential risk. You must be aware of the risks and be willing to accept them. Absolutely do not trade with money you cannot afford to lose.

By accepting this disclaimer you are acknowledging the risks involved in any trading product and are also acknowledging that you, and not Elite Trade Skills, are solely responsible for any losses, financial or otherwise, as a result of using this service. Elite Trade Skills shall under no circumstances be liable for any lost profits, lost opportunities, misstatements, or errors. You agree to hold Elite Trade Skills harmless for any act resulting directly or indirectly from your use of this site, its data, content, materials, associated pages and documents.

Elite Trading Skills Logo

Copyright © 2025 Elite Trade Skills | Privacy Policy